Land degradation - Local NPP Scaling Maps
Anthropogenic Land degradation Mapping
Principal Investigator: Dr. Steve Prince
Department of Geographical Sciences, University of Maryland, College Park, MD, USA @email
A particular gap in understanding of degradation is at scales larger than the local. This is the scale at which national, regional and international efforts can operate. However, an assessment of the extent, causes and processes of degradation affecting humans barely exists at the global to provincial scales.
Maps of degradation of Net Primary Production (NPP) developed using the Local NPP Scaling technique (Prince, 2016; Prince et al., 2009).
1. Zimbabwe, Africa
2. South Africa (N)
3. Sahel, Africa
4. Queensland, Australia
5. SW USA
1 Zimbabwe, Africa
Prince, S. D., Becker-Reshef, I., & Rishmawi, K. (2009). Detection and mapping of long-term land degradation using local net production scaling: Application to Zimbabwe. Remote Sensing of Environment, 113(5), 1046–1057. https://doi.org/10.1016/j.rse.2009.01.016
Local NPP Scaling (LNS) of Zimbabwe using the SOTR soils map and precipitation (SOTR-PPT) land capability classification. Municipality boundaries shown in black. Inset, higher resolution segment SW of Gweru showing communal area degradation (top left) and commercial area degradation (lower right).

2. South Africa
Wessels, K. J., Prince, S. D., Malherbe, J., Small, J., Frost, P. E., & VanZyl, D. (2007). Can human-induced land degradation be distinguished from the effects of rainfall variability? A case study in South Africa. Journal of Arid Environments, 68(2). https://doi.org/10.1016/j.jaridenv.2006.05.015
Map of slope of the residual-time regression. The residuals were calculated as the difference between the observed ΣNDVI and predicted ΣNDVI using the linear ΣNDVI–rainfall relationships. Pixels without statistically significant ΣNDVI–rainfall relationships are omitted (white).

3. Sahel, Africa
Rishmawi, K., & Prince, S. D. (2016). Environmental and Anthropogenic Degradation of Vegetation in the Sahel from 1982 to 2006. Remote Sensing, 8(11), 948. https://doi.org/doi:10.3390/rs8110948
Potential areas where anthropogenic degradation may be in progress (shown in red). Map derived from residual trend (RESTREND) analyses from 1982 to 2006.

4. Queensland, Australia
Jackson, H., & Prince, S. D. (2016). Degradation of net primary production in a semiarid rangeland. Biogeosciences, 13(16). https://doi.org/10.5194/bg-13-4721-2016
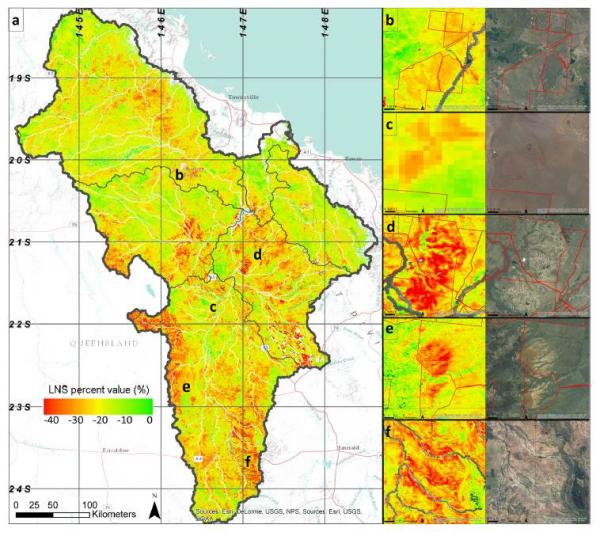
Local net production scaling (LNS) in the Burdekin Dry Tropics (BDT) (a) and enlargements of the areas indicated in (a): (b) high and low LNS values on either side of a station boundary, (c) variation within a single station showing gradients from low to high, (d) low LNS in eroded drainage area, (e) hillslope erosion resulting in bare surface with little to no vegetation cover, and (f) area of tree removal with visible erosion and reduced cover. Black lines are the boundaries of river basins and red lines are station boundaries.

5. SW USA
Noojipady, P., Prince, S. D., & Rishmawi, K. (2015). Reductions in productivity due to land degradation in the drylands of the southwestern United States. Ecosystem Health and Sustainability, 1(8), art27. https://doi.org/10.1890/EHS15-0020.1
LNS maps expressed as NDVI units. Blue areas (0) are at their reference condition and therefore interpreted as not degraded, while other colors show reductions below the reference condition. Black areas are masked land cover, land use types, roads, riparian buffers, and slope .15% were excluded. State boundaries shown in white.


